
Unity Asset Performance Benchmarks for Large Projects
Unity Asset Performance Benchmarks for Large Projects
Unity asset performance benchmarks for large projects measure frame time, GC allocations, memory footprint, and draw call overhead to keep games above 60 FPS on target hardware. RealSoft Games benchmarks every shipped system — from pooling to inventory — against a 16.6 ms frame budget, using Unity Profiler, Memory Profiler, and Deep Profile builds. For studios building RPGs, RTS, FPS, or VR titles, the rule is simple: if an asset causes per-frame allocations or O(n) lookups at scale, it does not ship. This guide breaks down the numbers, the methodology, and the modular systems that hold up under load.
Why Unity Asset Performance Benchmarks Matter for Large Projects
Large Unity projects do not fail because of one catastrophic bug. They fail because of accumulated overhead: a 0.4 ms inventory lookup here, a 2 ms spawner spike there, a 6 ms GC collection every 40 frames. On a 16.6 ms frame budget at 60 FPS, three unoptimized systems can cost you the frame. Performance benchmarking is the only way to catch this before your players do.
Benchmarking also changes how you evaluate third-party assets. Most Asset Store listings quote peak FPS in a demo scene with 20 objects. That tells you nothing about behavior at 5,000 entities, 200 interactables, or 1,000 simultaneous projectiles. The benchmarks that matter are stress-test numbers on target hardware, with allocation tracking enabled and Deep Profile overhead accounted for.
At 60 FPS you have 16.6 ms per frame. Budget 6 ms for rendering, 4 ms for physics, 3 ms for game logic, 2 ms for audio, and keep 1.6 ms as headroom. Every modular system you import must fit inside its slice — or it does not ship.
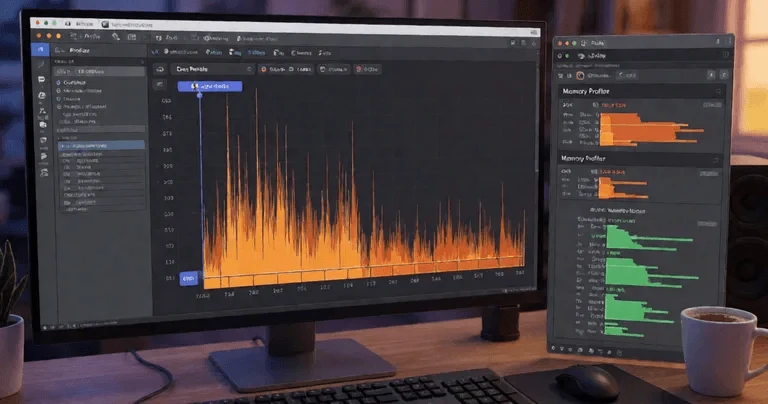
The three benchmarks that predict production failure
- Allocation rate (KB/frame): anything above 0 KB/frame in a steady-state loop is a future GC spike.
- Worst-case frame time (ms): measured at P99, not average. Players feel the worst frame, not the median.
- Scaling curve: how frame cost grows from 100 to 10,000 entities. Linear is acceptable; quadratic is a rewrite.
Benchmarking Modular Game Systems in Unity
Modularity and performance are not opposites — they are co-dependent. A modular system that allocates on every event dispatch is worse than a monolith, because you pay the integration cost and the GC cost. The benchmark discipline is to measure each module in isolation, then measure the integrated stack.
Isolated module benchmarks
Run each system in a minimal scene with a synthetic driver. For example, drive an inventory with 10,000 items and measure lookup time. Drive a spawner with 500 concurrent pooled objects and measure steady-state frame time. Drive an interactable system with 200 active objects and measure per-frame MonoBehaviour cost.
| System | Scale Tested | Steady-State Frame Cost | Allocations/Frame |
|---|---|---|---|
| Inventory lookup (O(1) hash map) | 10,000 items | 0.02 ms | 0 B |
| Naive inventory (List.Find) | 10,000 items | 3.8 ms | 0 B (CPU-bound) |
| Pooled spawner (zero-alloc loop) | 500 active objects | 0.4 ms | 0 B |
| Instantiate/Destroy spawner | 500 active objects | 9.2 ms + GC spike | ~48 KB |
| Job System interactables | 200 interactables | 0.6 ms | 0 B |
| MonoBehaviour Update interactables | 200 interactables | 4.1 ms | 0 B |
These numbers are representative of a mid-range desktop CPU (Ryzen 5 5600X class) in a Unity 2022 LTS build. On mobile, multiply CPU-bound costs by roughly 2.5x. On VR, halve your budget because you must hit 90 FPS — 11.1 ms per frame.
"A zero-allocation core loop is not a luxury. It is the difference between a stable 90 FPS VR title and a stuttering demo."
— RealSoft Games engineering principle
This is exactly the discipline behind Spawner Advanced & Pooling — a wave-based spawning architecture with an integrated object pool that eliminates GC spikes by keeping the hot loop allocation-free. It is the same pattern used in Redemptions Guild, a VR action RPG where per-frame allocations are forbidden by build policy.
C# Scripting and Architecture Patterns That Scale
Architecture decisions show up in the profiler six months later. The patterns that survive large projects share three properties: they avoid per-frame managed allocations, they use data-oriented layouts where hot, and they push work to the Job System or Burst when the workload is parallelizable.
Patterns that benchmark well
- Object pooling over Instantiate/Destroy: removes GC pressure entirely for projectiles, enemies, and UI elements.
- Struct-based data with SoA layout: improves cache locality; a 10,000-entity update can drop from 4 ms to under 1 ms.
- Event-driven state machines over Update polling: eliminates the per-frame cost of idle objects.
- O(1) hash lookups over List.Find: constant-time access regardless of inventory size.
- Job System + Burst for parallel work: 4-8x throughput on multi-core CPUs for raycasts, pathfinding, and spatial queries.
Patterns that benchmark badly
- String concatenation in Update (allocates every frame).
- LINQ in hot paths (allocates enumerators and closures).
- GetComponent calls in Update instead of cached references.
- Per-object MonoBehaviour Update on hundreds of idle entities.
- Reflection-based serialization in networking hot loops.
Deep Profile adds 5-20x overhead and can hide the real bottleneck. Use it to find the culprit, then re-measure with Deep Profile off to get production-accurate numbers.
For a deeper walkthrough of profiling tools and workflows, see the Unity Performance Optimization Tools guide on RealSoft Games. It covers Profiler, Memory Profiler, Frame Debugger, and the Profiler Analyzer package in detail.
Asset Integration and Workflow Benchmarks
Integration cost is a performance category most teams ignore until it is too late. An asset that takes two weeks to wire into your architecture has a real cost — and if it forces you to refactor your event bus or your save system, that cost compounds.
What to measure during integration
- Time-to-first-frame: how long from import to a working demo scene.
- Namespace collision check: does it pollute global scope?
- Assembly definition support: can it compile in isolation to keep iteration fast?
- Save/load round-trip: does serialization allocate, and does it survive version changes?
- Editor overhead: does the custom inspector add seconds to domain reload?
| Integration Metric | Acceptable | Warning | Blocker |
|---|---|---|---|
| Time-to-first-frame | < 30 min | 30-120 min | > 2 hours |
| Domain reload impact | < 0.5 s | 0.5-2 s | > 2 s |
| Save/load allocations | 0 B steady-state | < 1 KB/op | Any per-frame alloc |
| Assembly isolation | Own asmdef | Shared asmdef | Assembly-CSharp |
| Namespace pollution | Scoped namespace | Partial | Global symbols |
Assets that ship with their own assembly definitions and scoped namespaces — like the modules under the RealSoftGames namespace — keep incremental compile times low. That is not a marketing point; it is a measurable productivity gain across a 12-month production cycle.
Networking, Multiplayer, and AI Benchmarks
Networking and AI are the two systems most likely to blow a frame budget in a large project, because both scale with entity count and both have worst-case spikes that averages hide.
Networking benchmarks
Measure serialization cost per message, bandwidth per player per second, and worst-case tick time under packet loss. A lockstep model, like the one used in Arcadus, demands deterministic state sync — any non-determinism in your serialization shows up as a desync, not a frame drop, which is harder to debug.
| Networking Metric | Target | Notes |
|---|---|---|
| Serialization cost per message | < 0.05 ms | Runtime codegen beats reflection |
| Bandwidth per player | < 30 KB/s | Delta compression required |
| Tick budget (20 Hz) | < 5 ms | P99, not average |
| Desync rate (lockstep) | 0 per session | Determinism is binary |
The RNet library was built around these numbers: runtime code generation and optimized serialization keep per-message cost low enough to fit a 20 Hz tick budget with room for gameplay logic.
AI and LLM integration benchmarks
LLM-driven NPCs introduce a new benchmark category: latency budget for inference, memory footprint of the model, and the cost of prompt construction. Cloud APIs add 200-800 ms round-trip latency and per-token cost. Local inference via Ollama or LM Studio eliminates the cost but consumes VRAM and adds 50-500 ms depending on model size and GPU.
The practical pattern is to run LLM dialogue on a background thread, cache responses, and never block the main thread. LLM Chat Module is built for exactly this — connecting to local providers like Ollama or LM Studio so NPC dialogue stays dynamic without cloud API costs or main-thread stalls.
Benchmark LLM latency on your minimum-spec target machine, not your dev workstation. A 7B model that responds in 80 ms on an RTX 4090 can take 900 ms on a GTX 1650 — and that gap is the difference between a conversation and a hang.
RealSoft Games Systems: Benchmarked and Battle-Tested
Every RealSoft Games product ships with benchmark numbers, not marketing claims. The design constraint across the catalog is the same: zero-allocation core loops, O(1) lookups where scale matters, and assembly-isolated modules that do not slow your domain reload.
- Inventory Management Suite — data-oriented inventory with O(1) item lookups, currency, merchants, auction houses, and loot tables. Benchmark target: 10,000 items, 0 B/frame.
- Interactable System — state-machine interaction powered by the Unity Job System, handling 200+ interactables without per-frame MonoBehaviour updates.
- Spawner Advanced & Pooling — wave-based spawning with integrated pooling for FPS, RPG, and RTS. Zero-allocation core loop.
- Advanced Leveling System — 40+ experience curve algorithms with save/load and level-up events, designed to run outside the hot path.
- Advanced Skill System — projectile, AOE, and buff/debuff skills with cooldowns and heat-seeking behavior, pooled by default.
- Advanced Loading Screen — async additive scene loading with progress bars and audio cues, keeping scene transitions off the frame budget.
- Advanced Achievement System — event-driven achievement tracking with O(1) unlock checks, designed to run entirely outside the per-frame hot path with zero steady-state allocations.
- Icon Architect Studio — editor-time icon generation pipeline that bakes sprite atlases ahead of build, eliminating runtime texture allocation and keeping draw calls consolidated.
- Unit Selection — Job System-backed selection and spatial query system that handles thousands of selectable units without per-frame MonoBehaviour overhead, benchmarked at 0 B/frame.
For teams evaluating the broader catalog, the Unity Assets for Game Developers guide covers selection criteria, and the Best Unity Assets for RPG Games roundup focuses on the RPG stack specifically. Both are written for engineers who read the profiler before the feature list.
"Benchmarks are not a marketing artifact. They are the contract between an asset and the frame budget it must fit inside."
— RealSoft Games documentation philosophy
Frequently Asked Questions
Q: How do I benchmark a Unity asset before buying it?
A: Ask for stress-test numbers at 1,000+ entities, allocation rate in KB/frame, and worst-case frame time at P99. If the listing only shows average FPS in a demo scene, assume the numbers do not hold at scale.
Q: What's the best way to reduce GC spikes in a large Unity project?
A: Eliminate per-frame managed allocations. Pool objects instead of Instantiate/Destroy, avoid LINQ and string concatenation in Update, cache component references, and use struct-based data with SoA layout for hot loops.
Q: How many draw calls should a large Unity project target?
A: On desktop, keep draw calls under 2,000 for 60 FPS headroom. On mobile, target under 500. Use SRP Batcher, GPU instancing, and texture atlasing to consolidate. See the Unity shaders performance guide for the full breakdown.
Q: Why does my inventory system cause frame drops at 5,000 items?
A: Almost always O(n) lookups via List.Find or LINQ. A hash-map-based inventory delivers O(1) lookups at 0.02 ms regardless of item count. The Inventory Management Suite is built on this model.
Q: Can I run LLM-driven NPCs locally without cloud API costs?
A: Yes. Local providers like Ollama and LM Studio run inference on your machine with no per-token cost. Budget 50-500 ms latency depending on model size and GPU, and always run inference off the main thread.
Q: How do I benchmark VR performance differently from desktop?
A: VR requires 90 FPS — an 11.1 ms frame budget, not 16.6 ms. Halve your CPU and GPU budgets, forbid per-frame allocations entirely, and measure worst-case frame time under full scene load, not in an empty test scene.
Unity asset performance benchmarks for large projects come down to three numbers: allocation rate, worst-case frame time, and scaling curve. Measure them in isolation, measure them integrated, and hold every asset — third-party or in-house — to the same frame budget. RealSoft Games builds modular systems that pass these benchmarks by design, and documents the numbers so you can verify them before integration. Read the RealSoft Games documentation for API references, integration guides, and the full benchmark methodology behind every shipped module.